Exposure Values are a somewhat important concept, kind of, if you are trying to maintain consistent exposure while fiddling with your camera in manual mode. Realistically, by shooting in aperture or shutter priority, with your ISO locked down, your camera will maintain the proper exposure value for you anyway.
A photographer might need to prepare for any values between -6 and 16, and the difference of 1 exposure value is called a “stop”. Remember, though “stopping down” generally refers to using a narrower aperture, you can also decrease your shutter speed or ISO by one stop!
The actual math of this does not matter too much to a normal photographer. Or an abnormal photographer. It’s somewhat fascinating to think about this if you are designing experiments or writing software that does crazy camera things though.
Honestly, if you’re doing crazy math-based camera experiments, you probably didn’t need to read this. However, I’m upset that the equations for the exposure triangle (which dictate the relationship between iso/shutter speed/f-number) are not readily available without you solving for these elements yourself, so I figured I’d commit them to one place on the internet. If you need these, look no further.
Note many resources will give versions of these equations using EV_100, or Exposure Value at ISO100. No standards body has codified use of EV_100, and while some websites claim that “Light Value” refers to non-ISO100 EV (and sometimes the opposite, EV_100), this is inconsistent with contradicting definitions around the internet. Forget about light value, for now it’s not a useful term, it’s the math photography equivalent of “nonplussed”. Just use these equations, and if you want ISO100 or EV_100 plug in 100 for the ISO.
If these all feel like they are yielding answers that are just a littttle off- welp, congratulations, you’ve learned the dirty secret of photography. The fnumbers are very, very slightly rounded. Below is mathematically sound, where:
F is the relative aperture (f-number)
t is the exposure time (“shutter speed”) in seconds
S is the ISO arithmetic speed
EV is the exposure value
ISO
S = \frac{100 \times F^2}{t \times 2^{EV}}
Python
iso =(100*(fnumber **2))/(shutter_speed *(2** exposure_value))
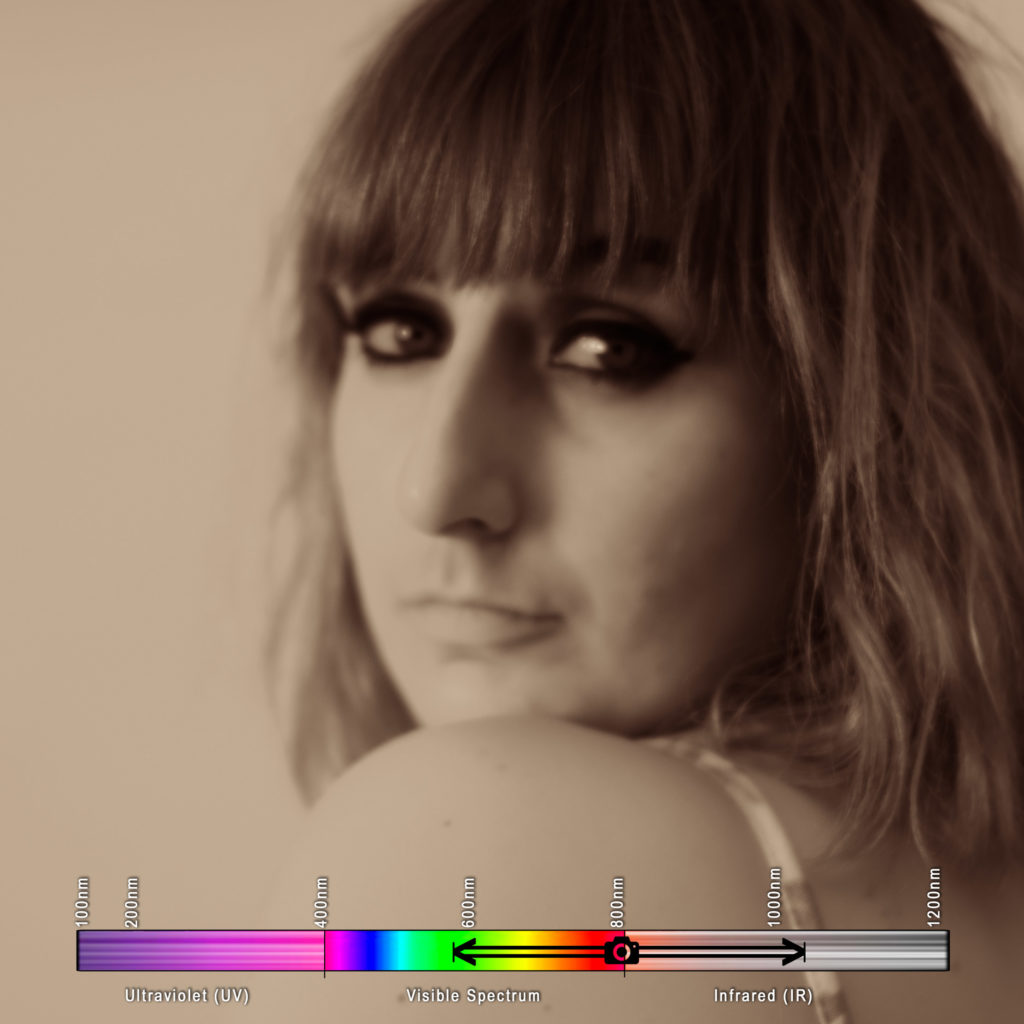
While I was waiting for burlesque bunny models to prepare for an upcoming shoot, a Danish traveler wandered into our set. She was goodly enough to pose so I could try out my brand new lens, which I threw on the nearest camera, my modified infrared Nikon. As has been demonstrated in past explorations, this is not the sharpest sensor, as there is no guarantee that a critical focus plane will even exist if your aperture is too open.
To my surprise, the new Daguerrotype Achromat lens, a recreation of the Petzlav design from 1839, worked perfectly with this modification. Apparently simplistic configurations are sharp as a tack in infrared, even while wide open!
As she was captured, straight out of camera:
Madeleine in Near Infrared + Infrared (590nm-~1100nm)
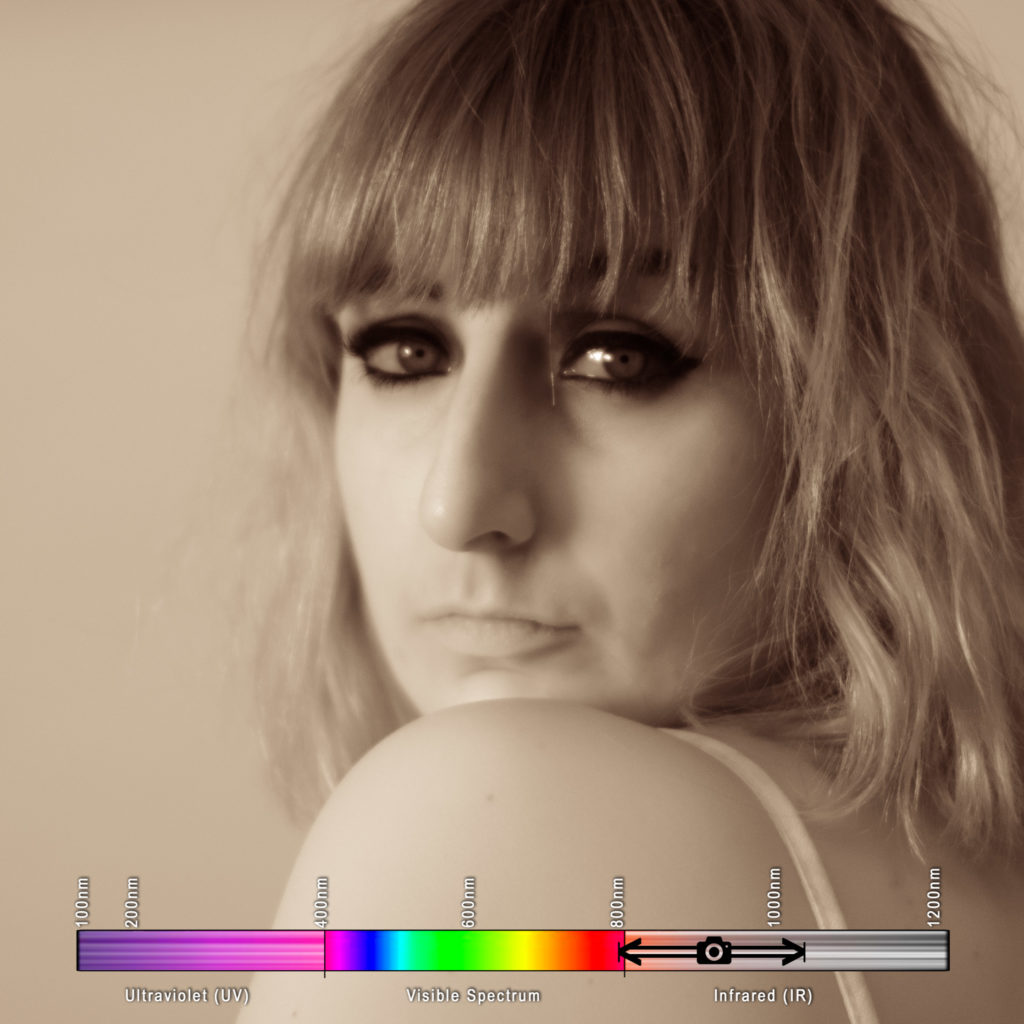
Of course, this is barely even a photograph. Let’s adjust this, and make it black and white:
This is a more presentable version of Madeleine
Great!
But what if we want color?
As we all know, infrared pictures look really weird in traditional “false color”, which is how modern digital photographers often present their infrared work. Obviously, it’s impossible to present an invisible spectrum without modifying it to become visible, so SOME color has to be given to it. Further articles on traditional false coloring will come, but a cursory Googling will provide a litany of tutorials.
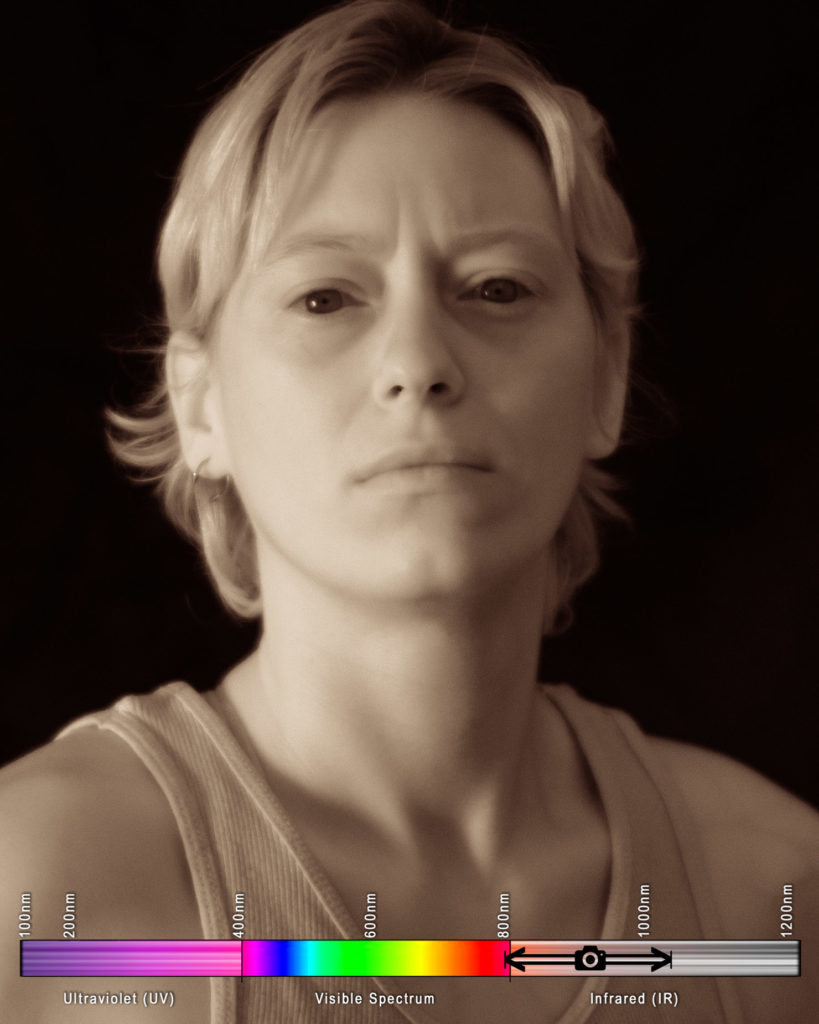
As an example, let’s look at the lovely Madeleine in this original infrared photo, after it’s been white balanced to pull the highlights into a blue range. She looks weird. And she’s not a weird looking girl:
White balancing the infrared to something more… “presentable”
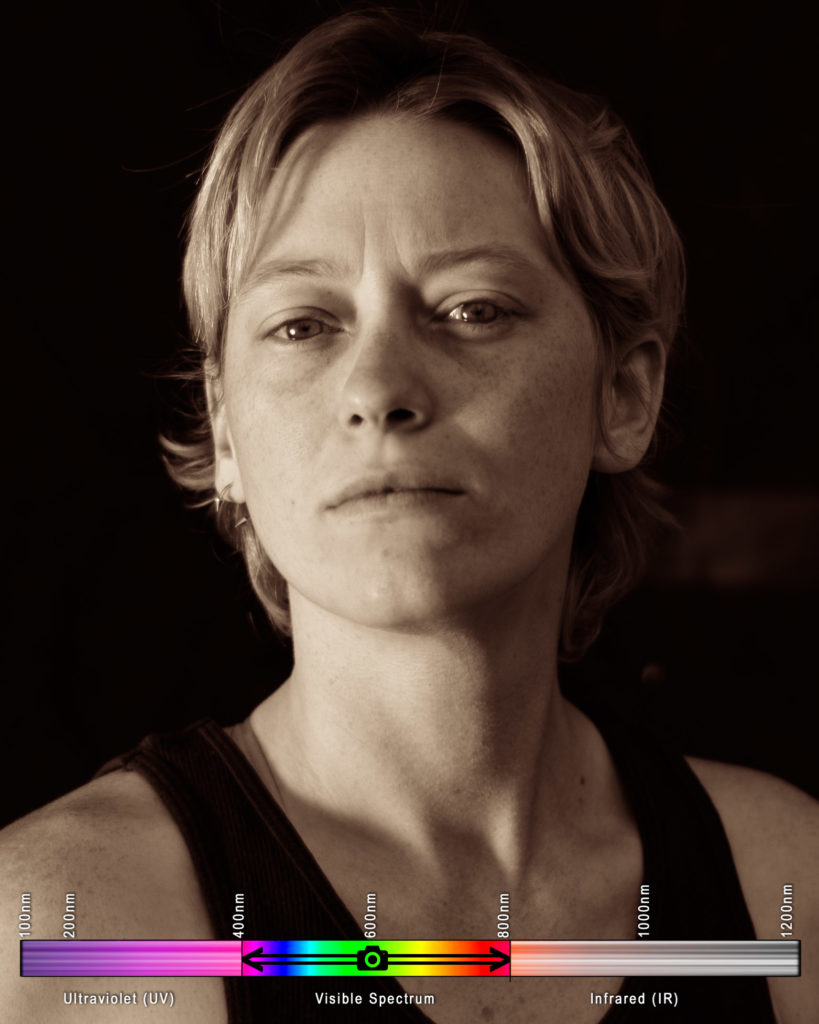
We swap the Red and Blue channel, as is the standard jumping off point. Ummm… Great? Now she looks weird AND sickly. We have done no good here.
This might be the traditional end-point of false coloring infrared photographs, but obviously this can’t be used on a human subject.
But perhaps there is another way? I’ve been poking at machine learning for some separate projects, so maybe we can use an artificial intelligence to fill in some gaps for us.
I’ve been interested in the work of Richard Zhang and the work he did with Phillip Isola and Alexei A. Efros on using artificial intelligence to colorize things. It seems a solid use of “Deep Learning” to train an AI on a large set of images, then have it color an image for you. You can read more about here, if you want! http://richzhang.github.io/colorization/
Let’s pop the first black and white image from above into Zhang, Isola, and Efros’ automatic artificial-intelligence colorizer, a demo of which he provides freely at https://demos.algorithmia.com/colorize-photos/
AI, in the form of Algorithmia’s “Colorize-It”. Interesting, if not good. This does give us the distinct impression of… kind of color.
Interesting. Kind of.
Ultimately we see that AI recognizes that there is, in fact, a girl, and the AI’s model (think of this as the memories the AI has retained from past studies) recognizes foliage pretty well.
The only problem is, I’m not interested in foliage turning green, or the model’s eyes turning brown. I don’t much care for the colors bleeding out of the edges, either. I came to make a candy-colored infrared nightmare, and make a candy-colored infrared nightmare I shall!
Instead, I did more reading, and found this paper, a further exploration that involved Zhang, Isola and Efros. https://richzhang.github.io/ideepcolor/ By “steering” an AI, pointing to where certain colors should be, perhaps we can make a more interesting picture?
I followed some simple directions to run this code on a Mac, and within a few minutes of getting the program started, I had colorized a version I liked! No training or reading instructions was necessary. It was largely very intuitive.
Using iDeepColor is fairly intuitive.
To use iDeepColor, simply mouse-over a spot on the image on the left, click, wait a second, and see what the AI recommends. Chances are pretty good many of the points are going to already be a reasonable value, so simply click a point of color you like, and when the palette is recommended, do nothing. Click to a point where you’d like to change the color, then choose a color in the a b color gamut. I believe this to be a* b* channels, from the 1976 CIE L*a*b* space, but we’ll explore this later. You may have to get finicky, adding a few points around an area you’ve just defined, to keep the color from bleeding out.
Honestly, despite the frustration of not having a “zoom” ability, or an “undo” function, this was so intuitive there seems to be little left for me to explain.
After about 20 minutes futzing about, I was left with this:
iDeepColor after about 20 minutes. Now this is exactly what I was looking for.
Is it perfect? No. Is it novel? Absolutely! In fact, it gives me some ideas for colorizing more competently in Photoshop for future endeavors.
I hope this inspires some creative steps with colorization and AI in hyperspectral photography!
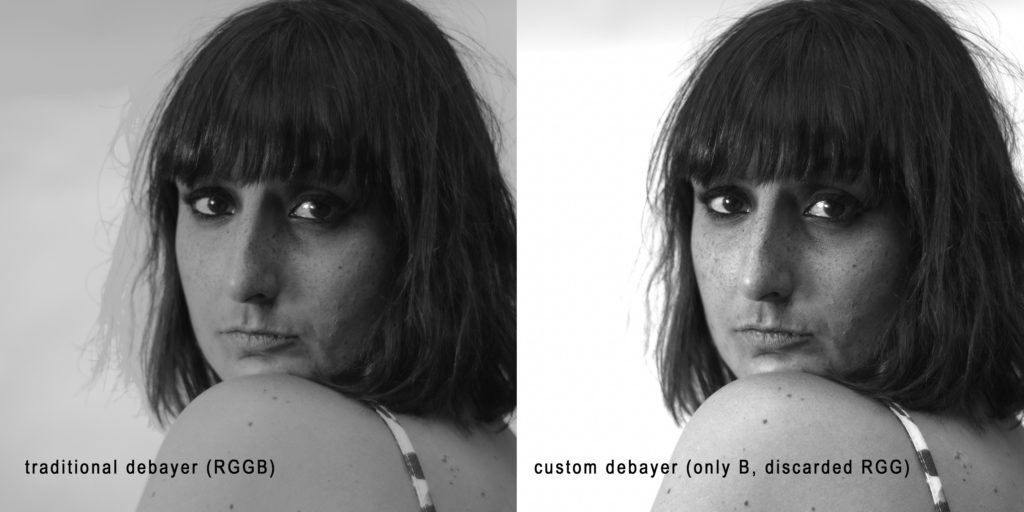
After reading my post on how to recreate the look of tintype and wet-plate collodion digitally, you may have been left wanting the code to appropriately demosaic/debayer.
This is a photography blog, not a coding blog, so please bear with me for my first go at making this accessible.
To recap from my earlier posts:
In looking at an image captured through a B25 glass, you will only capture 1 out of every 4 pixels correctly, thanks to the debayer color filter array (CFA) on top of your digital camera’s sensor. That means 3 pixels are “dead” or, at least “incorrect”. Here’s a quick script to throw them out.
As we can see in this close-up of the raw data, this image has a lot of dead pixels. Let’s get rid of ’em.
I know I will get some feedback that this is not a debayer, or demosaic, in any traditional sense. You are technically right, haters. This is simply a downsample to strip out the three dead pixels.
You will quarter the resolution of your image with this process. I’m sorry, but it has to happen. The resulting clarity will play nicely with any upscaling processes you then wish to engage upon, however, and, especially in portraiture, artificial intelligence can work wonders.
I originally wrote this in MATLAB, but instead let me give it to you with freeware.
Software Requirements
You will need the following command-line tools. These are free, but if you aren’t comfortable using a command line interface (CLI) then I have bad news for you- this is unfortunately how you’re going to have to do it.
ImageMagick – This is THE tool for altering an image from the command line. It exists for all platforms, so whatever computer you are running, you can use it.
DCRaw – This is THE tool for opening raw files from a digital camera. RawTherapee is a front-end for this tool. Unfortunately, you still will have to install it, even if you have RawTherapee, to use the command-line interface.
I recommend, if you are on a Mac/Linux, simply using homebrew to grab these- open up a terminal window, and type
homebrew install imagemagick
and then
homebrew install dcraw
On PC, this might be a bit more complex, but these tools exist for all platforms, which is why I chose to code in this fashion.
Assuming these are installed correctly, you should be able to run this single line of code to demosaic down to the blue sensor pixel.
The Code
Open a terminal window, navigate to where your RAW file lives, and type:
(-c) Output in a fashion that can be handed off to ImageMagick (STDOUT for piping)
(-D) Monochromatic, untouched output
(-T) Tiff
(-6) 16 bit
(-g 2.4 12.92) gamma 2.4 with a toe-slope of 12.92, which is, more simply put, the appropriate setting for sRGB.
(-o 1) Set the colorspace to sRGB with a d65 white point. You can tinker with this, but ultimately it shouldn’t make too big of a difference, since we are compressing to a monochromatic pipeline here regardless.
Note that some tutorials will tell you to use a -4. This will output a linear electro-optical transfer function, and unless you really know what you’re doing, you probably don’t want this. I would argue you really don’t want this.
This then pipes ( | )the data to ImageMagick- or rather the utility it provides named “convert”:
(sample 50%) Downsample at 2:1, implied that you are dropping every other pixel in both X and Y directions
(-roll +1+1) Offset your image by the requisite number of pixels to place a blue pixel at the top left of the image. Assuming RGGB, this is +1+1. If you have BGGR, then this will be +0+0. I recommend trying them both. Heck, you can try +0+1 and +1+0 to see what would typically be the two green pixels. The one that looks the brightest is your correct image.
Close-up on the result: This looks dim and, dare I say, stupid. It looks like we’re peering at the data captured by the red pixel of the color filter array, which is the “leakiest” of the three color filters, accepting some blue light.
Close-up on the result: Looks identical to the last one- this means that, as anticipated, we are looking at one of the two G pixels on the color filter array.
Closeup of the result: Bingo! This is the blue pixel!
Not surprisingly, OutputTest_D matches the blue debayer pixel for my Nikon.
Note this is for a traditional bayer filter. You might wish to review the description of color filter arrays, and see if there is a better fit for you and your sensor. I don’t have the foggiest of how this might be accomplished with an x-Trans color array filter with free command-line tools, unfortunately.
While I was visiting San Francisco, Kristy Headley, a dear friend and fellow engineer, showed me her studio. There I was lucky enough to sit for her while she did some vintage tintyping. Tintyping was one of the earliest forms of photography, popular in the 1850s. It was a kind of incredibly inconvenient polaroid- the photos were exposed instantly after a quick wash on plates of iron or aluminum (never actually tin). All you needed was a very, very large camera, plates treated with “collodion” to make a light-reactive surface, and a sizeable collection of chemicals- Unfortunately, the genuine process has a high risk of explosion, creating cyanide gas, incurring blindness from silver halide splashback, or getting whacked out on ether.
“Dusty” Tintype/ferrotype by Quinn Jacobson – CC BY-SA 3.0
Kristy showed me each painstaking step, and I was enamoured with the result. With her mastery of lighting techniques, she’d produced tintype photographs where every detail popped- every freckle, hair, and eyelash seemed to stand out. Yet, these looked very different from modern photography. There was a certain, seemingly unquantifiable trait to them. Why?
I sought out to quantify this ol’ timey look, and the fashion by which one could reproduce it with a digital camera. Perhaps I could share in this delight without keeping jugs of volatile chemicals in my room.
Look to the Spectrum!
Kristy had told me that her exposure plates were only sensitive to certain colors: UV, blue, and some green. There was a specific range of wavelengths this collodion emulsion was sensitive to- one that doesn’t match human vision.
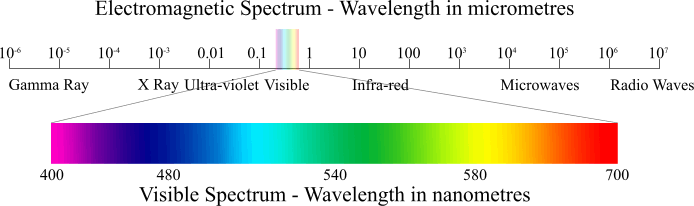
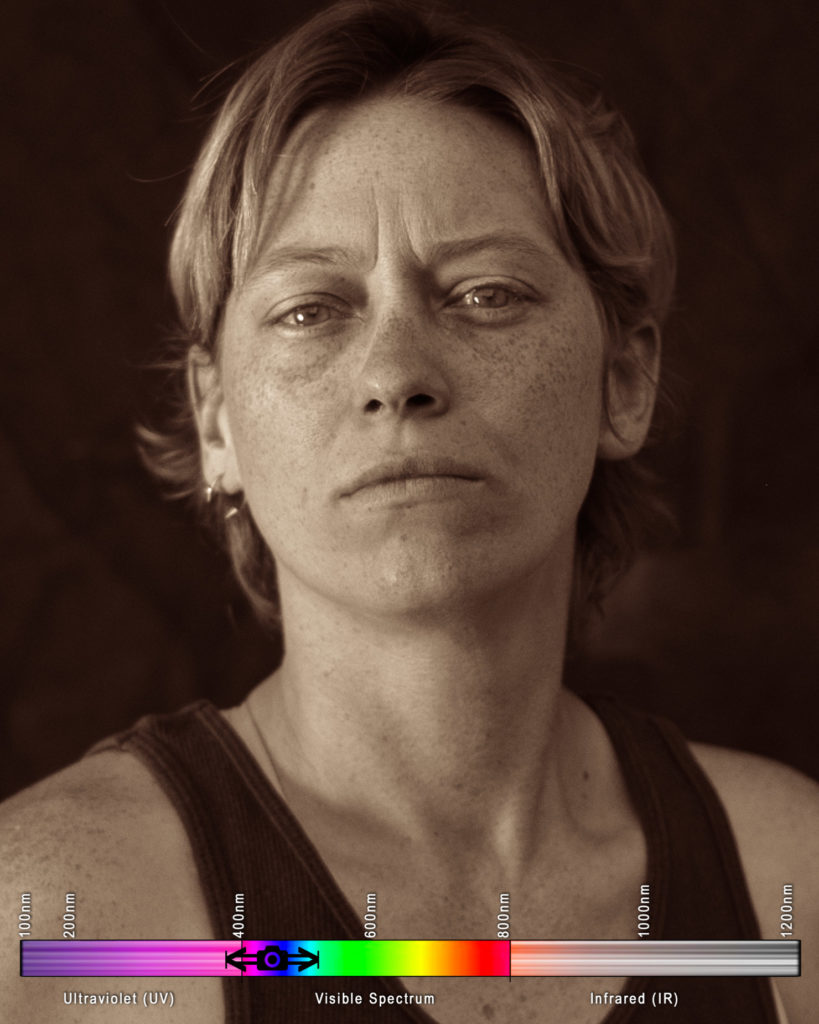
Human vision, as we can see above, is a sensitivity to the electromagnetic spectrum. Electromagnetic waves between about 400 and 700 nanometers will be perceived as light to us- the seven colors of the rainbow! (Interesting article about this to come later) If we dip to wavelengths shorter than 400, we get imperceivable ultraviolet (UV) light, and rise to wavelengths above 700, we get imperceivable infrared (IR) light.
But what do vintage photographic emulsion surfaces see?
Engineer Niles Lund seems to be the only person who has researched the spectral sensitivity of collodion, the emulsion chemical stew used to make wet-plate and tintype photographs in the mid-1800s. After exchanging a few emails, Niles sent me this updated spectral chart.
So now we know what to recreate if we want “digital collodion”! We need to cut out the upper half of the visible spectrum allowing nothing above about 520 nanometers into the camera.
I’ve done much work in this field, so I thought this would be a great time to blend science and art to explore this concept, and compare it to other hyper-spectral imagery!
Setting up an experiment
Now we invite some friends and models to come sit for us! I asked the models to avoid skin-concealing makeup and zinc-oxide sunscreen, which is the only sunscreen to obstruct UV-A rays. They were asked to model under a broad-spectrum light source (the sun), with an additional light source of a silver reflector, and maintain a pose for a few minutes while I photograph each under the following conditions:
Visible Spectrum
This is what humans see (obviously). Using three cones, sensitive to three different ranges of wavelengths, which loosely map to red-green-blue, we see everything from violet to red. Violet is the shortest wavelength. Red is the longest. Not surprisingly, this is what digital cameras see, as well. Silicon photovoltaic sensors, whether CCD or CMOS, can take in a theoretical 290nm to 1100nm. However, it would be maddening to have your photography overexposed, blooming, and flaring due to lightwaves you cannot see, to say nothing of threats of overheating, so sensors are limited by optical filters placed directly over the sensor to only photograph, more-or-less, in the human visible spectrum. Photons that don’t play nice in this range are either bounced back out of the lens, or absorbed and destroyed.
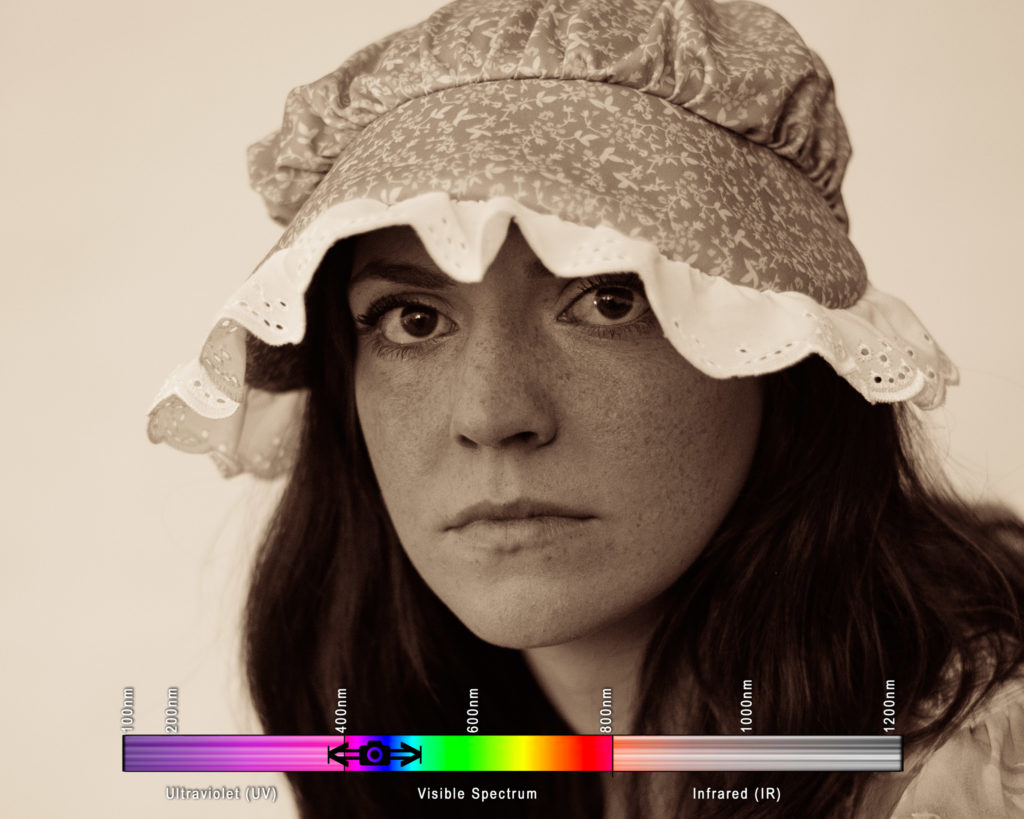
Here’s what our model Kayla looked like in the visible spectrum:
Captured on an unmodified Nikon D610 through a normal UV-limiting 50mm lens. Notice her light freckles, dark shirt, and slightly light eyes
Orthochromatic Blue (Collodion AND Squid Vision)
This could be seen as the same spectrum that octopus and squid might view in. Humans, except for rare and awesome mutants and the colorblind, are “trichromatic”, with three cones that allow for three different ranges of wavelengths in. Cephalopods only have one- the S cone, which is sensitive in almost the exact fashion of the spectral curve of the 1850’s collodion (except for UV). Though they might have a different mechanical use of their eyes, which could allows for more color vision, but I digress…
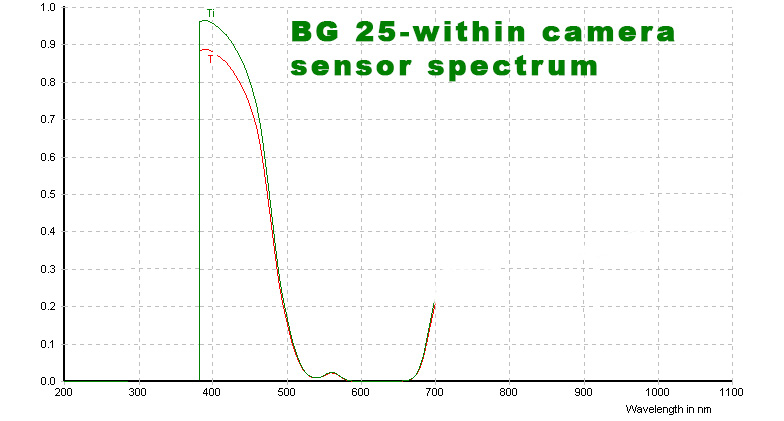
By using Schott BG25 bandpass glass, bought off a gentleman who fits esoteric german glass into filters, on a lens that cuts UV (any normal lens) on any unmodified camera, we get a theoretical spectral sensitivity that looks like:
The “double bandpass” ionically colored glass made by Schott AG in Germany nicely mimics the spectral response of the collodion.
Of course, all the photons that this can transmit that the camera can’t capture become irrelevant, so on an unmodified camera, we will get a spectral response that looks like:
This means that on an unmodified camera, using a lens that doesn’t block UV, we’re going to get an image where the focus is going to be more on near-UV damage to the skin- concentrations of freckles and blemishes are going to much more pronounced. There’s going to be a light leak of very red photons, and we’ll be missing much of the UV range, but we’re very close to vintage emulsion now.
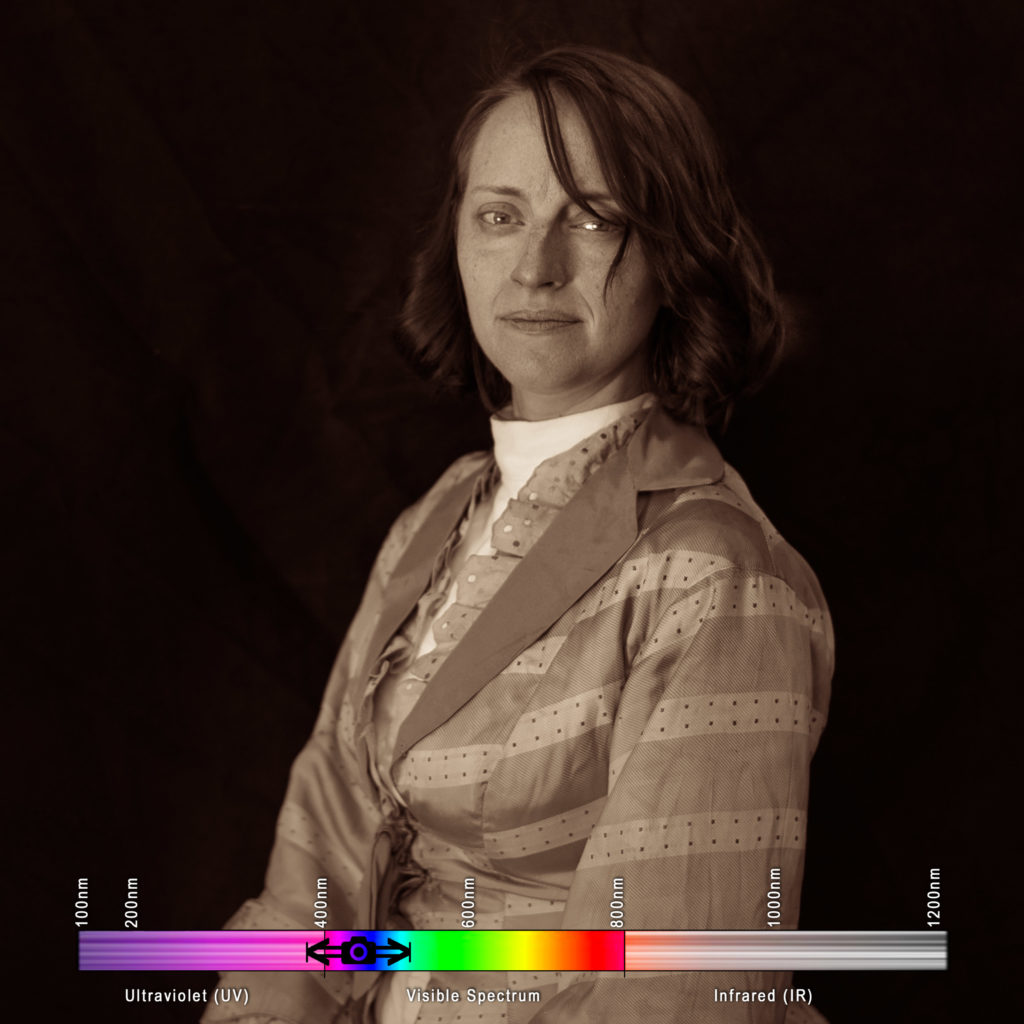
Our model, under the same lighting conditions (with an exposure compensation of +.7, calibrated from an 18% gray card):
Captured on an unmodified Nikon D610 through a UV-permitting 50mm lens and a BG25 double bandpass filter. Notice her pronounced freckles, dark shirt, and very light eyes
By gum, we’ve done it! With that nanty narking, I think we can say we’ve captured the ol’ timey feel of collodion!
…but it is not scientifically accurate. This is about the best we can do on an UNMODIFIED camera, as we need some expensive modifications to allow UV to extend into the sensor. More on that later.
Let’s see what she looks like in some other, more bizarre wavelengths!
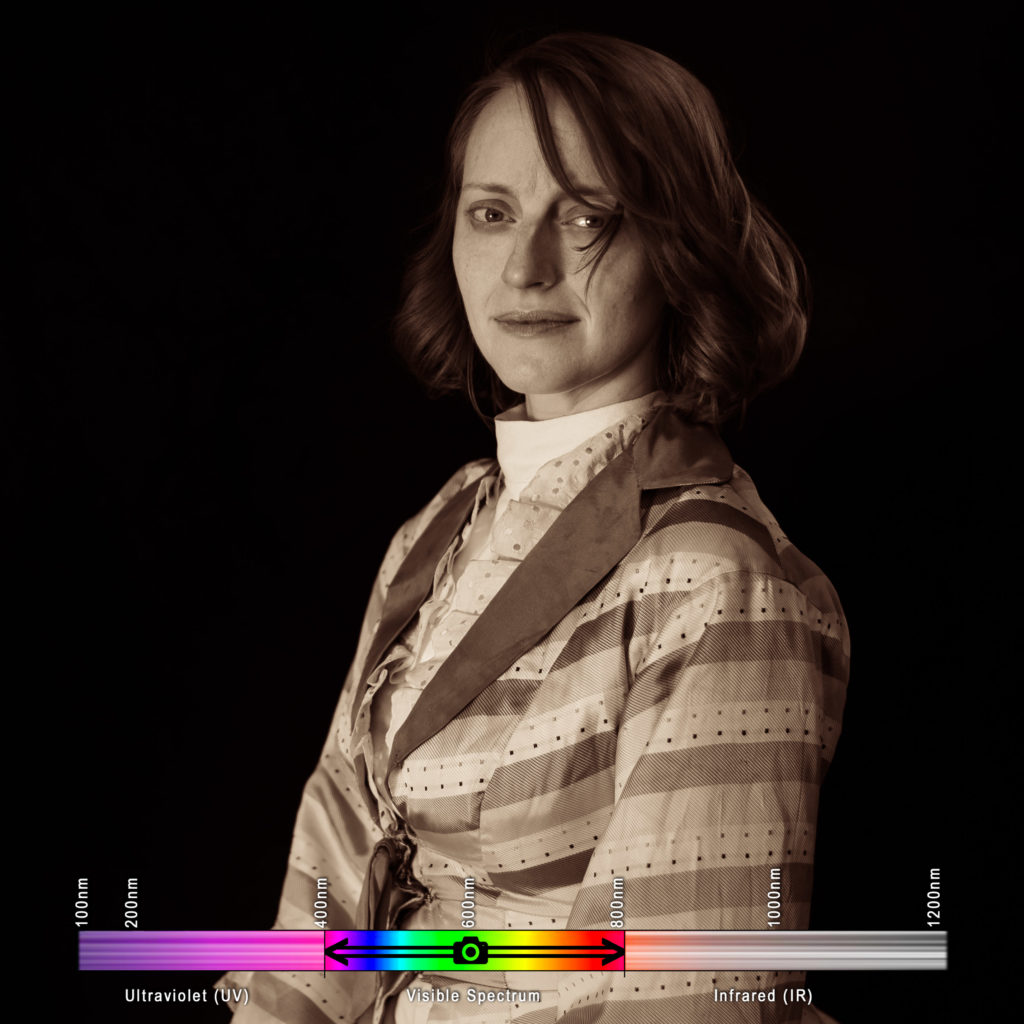
Near Infrared and Short Wave Infrared (Snake Vision)
This is, likely, what snakes see. This is the orange-and-red human-visible spectrum (near infrared, or NIR) and the infrared waves closer to the human spectrum. This is what I like to photograph foliage in, because it can be false colored and remapped using the color channels that your camera knows how to deliver data in. I have a Nikon D80 that has been modified to shoot in this wavelength, with an upper infrared spectrum bound (unmeasured) limited only by the physical limitations of a silicon CCD.
For some reason, for the duration of this experiment, this setup absolutely refused to focus properly. This camera does not have live-view, and it is very difficult to assess these images until they’ve been processed on a computer. Nonetheless, these blurry images were interesting…
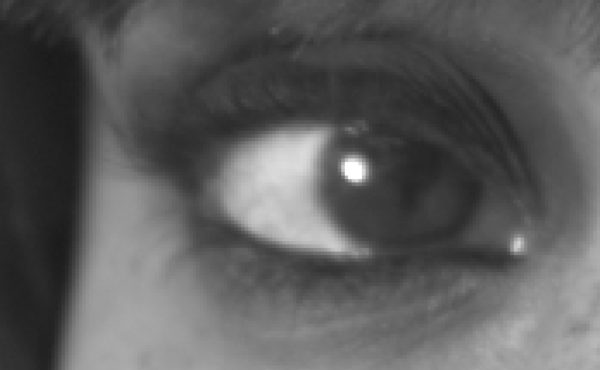
Captured on a modified Nikon D80 through normal 50mm lens, no filter. Notice there are no freckles, and her shirt appears grey.
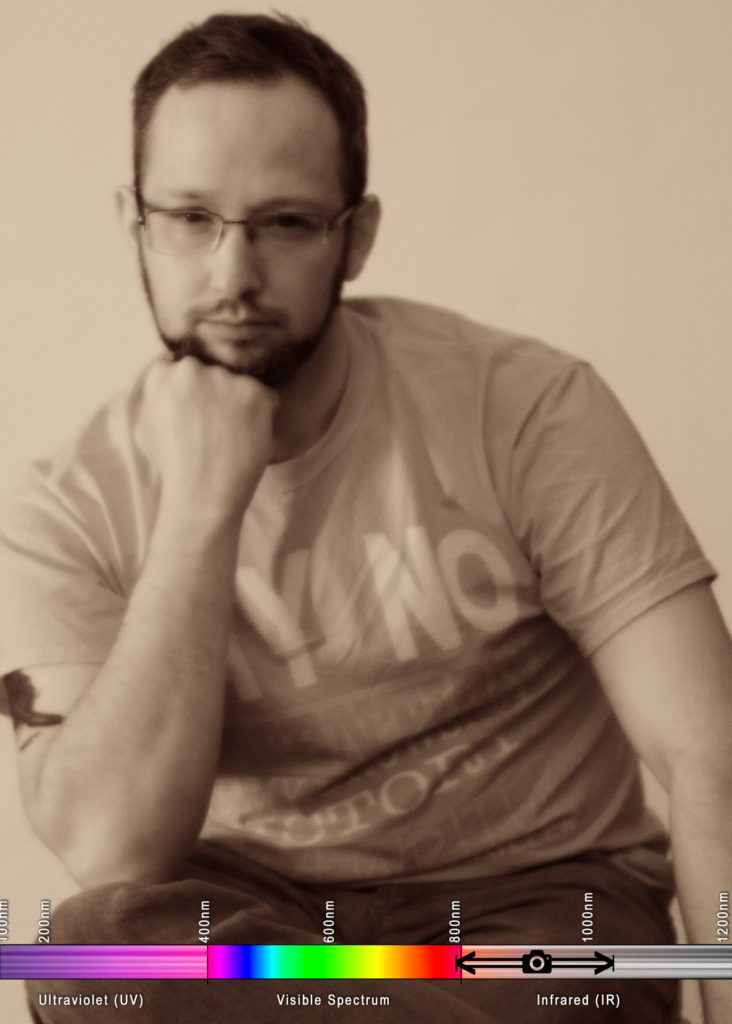
Short Wave Infrared
I don’t think anything “sees” solely in this spectrum, though it is a difficult concept to explore, so perhaps time will tell. To capture the full breadth of short wave infrared, or to move into longer wave infrared, we would have to use a special sensor made out of indium gallium arsenide. It’s interesting to see that any sun damage and melanin deposits, such as freckles and tans, will not appear in this wavelength. The IR photons do a good deal more sub-surface scattering in the skin than visible light, rendering each person as a waxen figure.
Captured on a modified Nikon D80 through a normal 50mm lens and a BG25 double bandpass filter. Notice there are no freckles, her shirt now appears white, her eyes have darkened considerably, and all of her skin appears waxen and soft.
Polishing these photos up a bit in a vintage style split-toning
You might have noticed these are not delivered in monochromatic black and white, as in the style of a silver gelatin process. Instead, I chose to render them out with a bit of split-toning. Since the birth of photography, this was a common practice, using various methods to bring color to the highlights and to the shadows.
In this case, I made the highlights gold to mimic the flame-gilding of the mid 1800s, which “fixed” the highlights of a photograph using a gold chloride solution and an open flame. As ambrotypes caught on in the 1860s, “ruby” hued backs became more common in photography- so I enjoy using a red tint in my lowlights.
A Horrible, No-Good Problem Arises in the bayer filter!
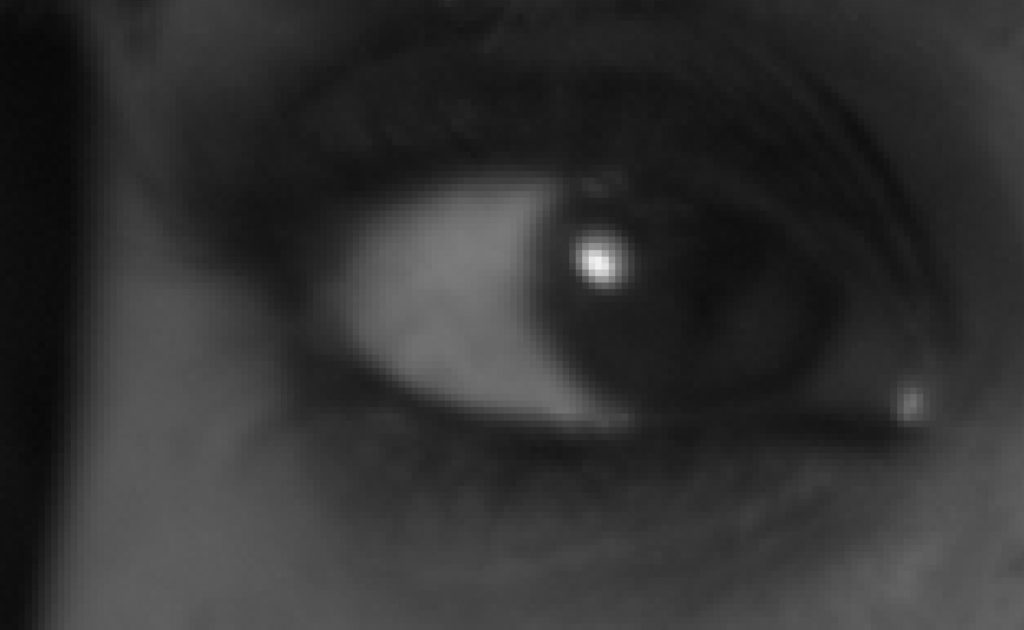
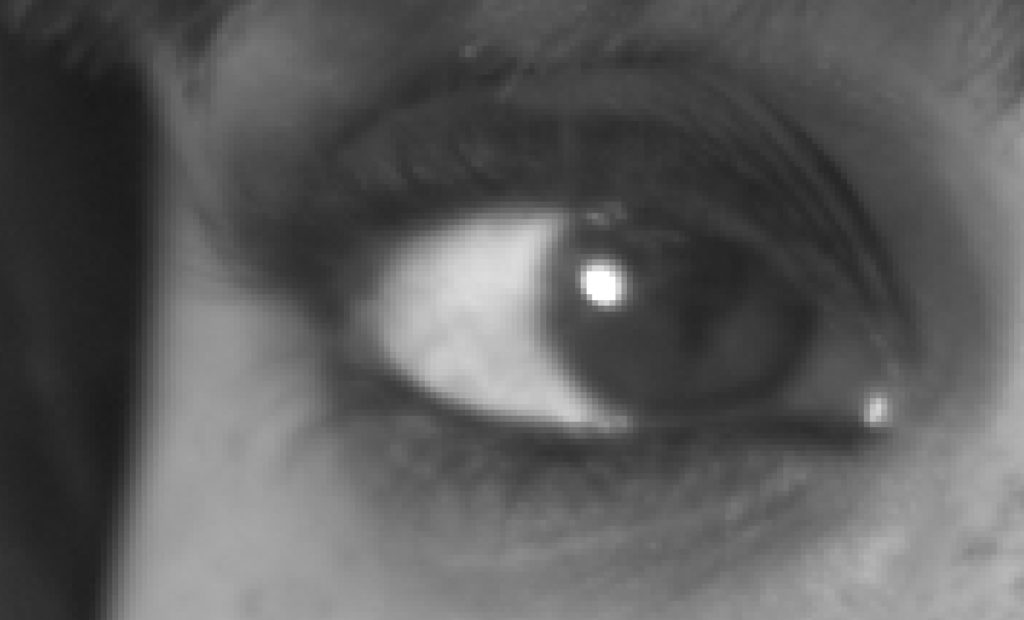
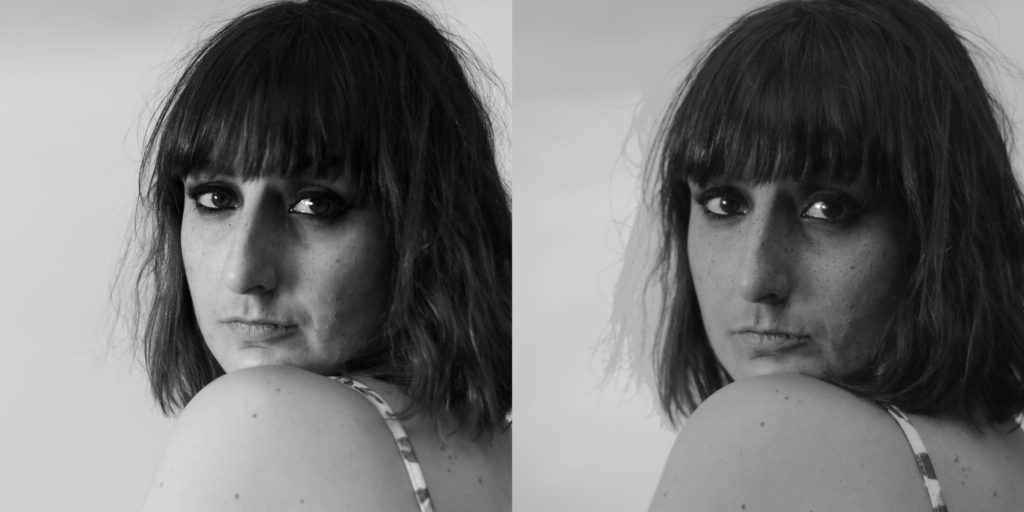
The images I captured occasionally showed very odd artifacts. Fine hairs would get lost, and appear in a fashion that almost looked like… a shadow? But why would such a thing happen?
Human-visible spectrum photo (left) shows frizzy hair, as anticipated. Limited orthochromatic spectrum photo (right) renders the hair as a weird blobby shadow. Why?
Then I realized we’ve surpassed the intention of a digital sensor, and we’re paying the price.
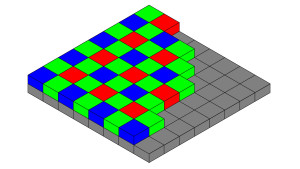
All digital sensors are actually monochromatic- black and white. In order to capture color, a translucent, microscopic grid of red, green, and blue tiles is spread across the sensor, with one tile to each pixel. This is a “Color Filter Array”, or CFA. Conventionally, this grid is laid out in a “Bayer pattern”, named for the Bryce Bayer of Eastman Kodak, who conceived of this. This Red-Green-Green-Blue pattern mimics the human eye’s sensitivity (a range where two of our three cones’ sensitivities overlap), allowing for more green to be considered by the camera. Interesting fact, this was supposed to be Cyan-Magenta-Yellow, to better subtract out the wavelengths necessary, but the technology simply did not exist at the time of inception to make such a CFA.
The Bayer filter atop a sensor
The sensor still functionally reports the incoming light as black-and-white, but now the camera, or camera raw processor if you move it to a computer, performs a process called “demosaicing”, or “debayering”. This reconstructs the image in four pixel groups, using a variety of different methods, depending on the camera and the software, finally outputting RGB channels in full resolution.
This means every digital photograph you have ever taken has functionally been reconstructed from quarter-resolution samples! Obviously, we haven’t noticed it, so we don’t really mind, but when we’re missing an entire wavelength (red), and sharply attenuating another (green), we’re only effectively using one out of every four pixels.
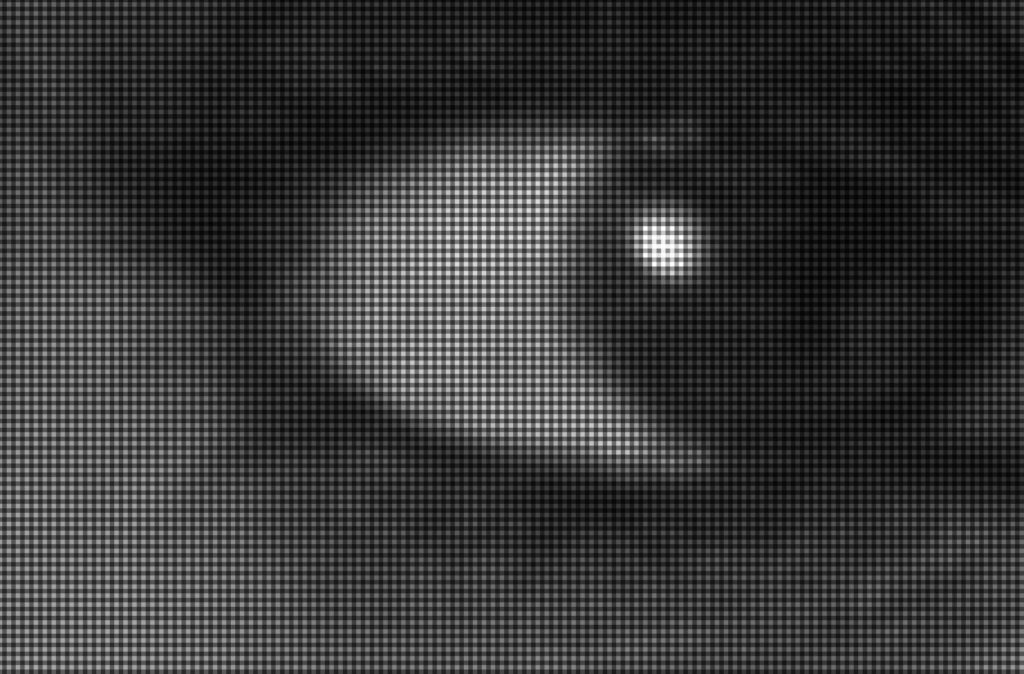
A closeup of an image captured in the “collodion spectrum”, pre-demosaic. Note only 1 in 4 pixels is appropriately captured.
Using RAWTherapee, the discovery of which was a definite win in this project, I could explore my sensor data before it was demosaiced and processed into the image I would see on a screen. As you can see above, it was disheartening.
What is a demosaic process supposed to use to rebuild the image? Without the appropriate data, it simply uses blank black pixels to try and interpolate data. This is going to get weird. Without writing your own demosaic algorithm, and accompanying debayering software to run it, there is no fix for this. (Update: I fixed it by writing my own demosaic algorithm and accompanying debayering software.)
Images captured in the “digital collodion” spectrum on a color digital camera will always get a little muddled when opened by your camera or photo editing software because of this simple fact. The luminance will be interpreted as ~60% less than it is, artificially flattening an image. Details will be lost, and reconstructed as goo.
Immediately after posting this I thought to look at the spectral response of each of the bayer tiles. It turns out the blue tile perfectly matches the orthochromatic technique, so I can effectively write an algorithm to simply crop the other 3 pixels, reducing this to a highly accurate 1/4 resolution. Updates to follow.
Update: Fixing the Debayer Problem!
After writing a surprisingly simple script in Matlab, which did an embarrassingly simple downsample to throw out the three pixels that were not relevant to the spectrum we captured this in, we have a solution. I cannot stress enough, we got lucky. This almost teaches bad color science- you typically cannot select a wavelength in post. We just got very, very, comically lucky and found that my Nikon D610 uses the same spectral sensitivities in the blue bayer tile as collodion once did. That is an odd coincidence, to say the least. This is worth researching more on later.
I will later rewrite this script for free interpreters, so that anyone can follow in my footsteps without spending money on expensive coding platforms. A full new article will be posted exploring this. Update: You can find the code, run on freeware, to perform this in my next post.
The Results are Stunning
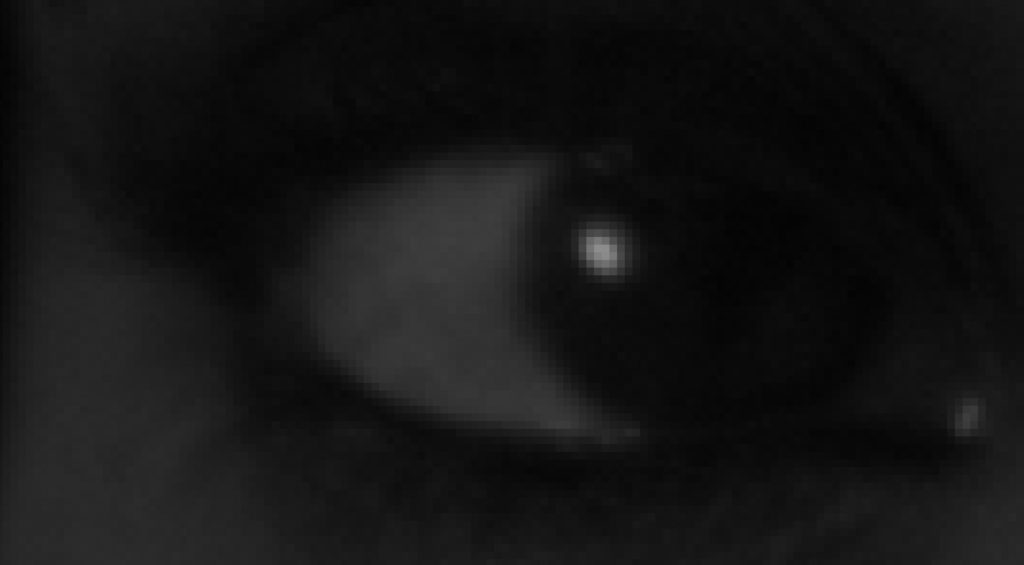
Image as brought in from the camera (left) vs run through a custom de-mosaic (right)
The differences far surpassed what I expected. Pleasantly, the math suddenly matched up to what my light meter had suggested in my camera. Now, without any exposure adjustments, the photograph matches the levels of the full-spectrum photo- remember, I had already taken exposure compensation into consideration, allowing an extra 2/3s of a stop of light, when I took the photo.
There’s no bringing back the fine details- those little wisps of hair are lost to the ages, but they didn’t become a gooey mess. So much detail has been restored to the photo, I am absolutely stunned. I did not expect this level of improvement. I went back and reuploaded this spectrum in the earlier section with Kayla.
One more comparison:
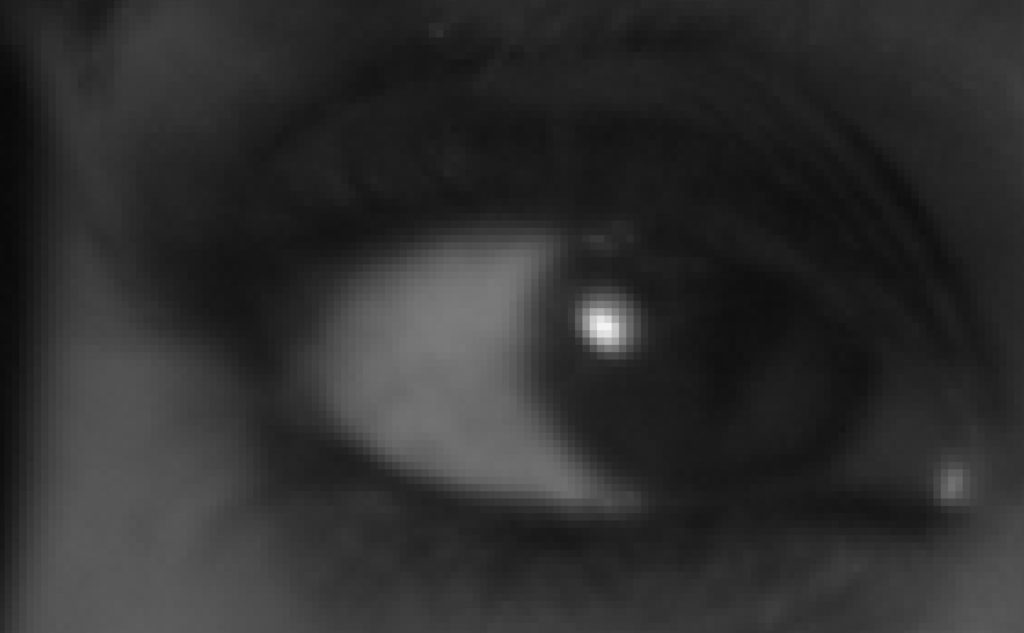
Image as brought in from the camera (left) vs run through a custom de-mosaic (right). The difference and detail recovered is nothing short of stunning.
Perhaps my short-wave infrared photos could benefit from this process as well?
All of the Photo Results
All results delivered as near to from-camera as possible, using small exposure adjustments to match skin tone. When gradient adjustments were used, they were used uniformly across all photos of the model, to keep lighting consistent between wavelengths.
Kaitlin
Kevin
Christine
Xach
Caitlin
Kayla
Next Steps to Take it Further
In order to fully and accurately capture the collodion sensitivity range, I need to not only use a lens that allows ultraviolet photons to pass, as used in this experiment, but a camera with a sensor modified to receive UV light. Because this is not a fast or cheap prospect, I’ve been dragging my feet to see if this could be done in conjunction with another modification…
As photographing humans draws no benefit from presenting false color, hyperspectral photography (such as UV) is best delivered in black and white. Due to the problems with the bayer pattern described above, having a color sensor actually hurts collodion-spectrum portraiture- if the construction of the image relies on a missing red channel, then we need to have a monochromatic sensor to gather an image using the filters described in this process with due sharpness. So we have two options (Update, a third option has arisen): Buy a monochromatic camera, which can run between 3,000 and 50,000 dollars, or do a “mono-mod” to scrape the bayer filter off of an existing camera. Conversion shops have assured me this is impossible on the Nikon cameras that I like to use, but I hold out hope for a “full spectrum” monochromatic modification. Alternatively, now that a custom debayer option exists that quarters the resolution, I can look into intelligent upscaling, possibly using AI to regain resolution lost in the process.
Final Thoughts
As I used attractive models in this experiment, instead of the lab tools one should use to characterize optics, the spectral range of each photograph is an educated guess at best, based on theoretical readings. Lab characterizations will follow.
Trust the math. I know things look underexposed and incorrect, but if you’ve set your exposure compensation based off an 18% gray card- or, realistically, ignored that and just set it to +.7, then you can trust your lightmeter shooting in “orthochromatic blue”.
Don’t trust the Bayer filter. Its bad and should feel bad. Consider this in any hyperspectral pursuit, and any pursuit where you are limiting your input wavelengths via optical filter.
Sometimes, there’s no substitute for the real thing- recreating wet-plate collodion and tintypes is severely limited by digital consideration- but limitation is the mother of invention!